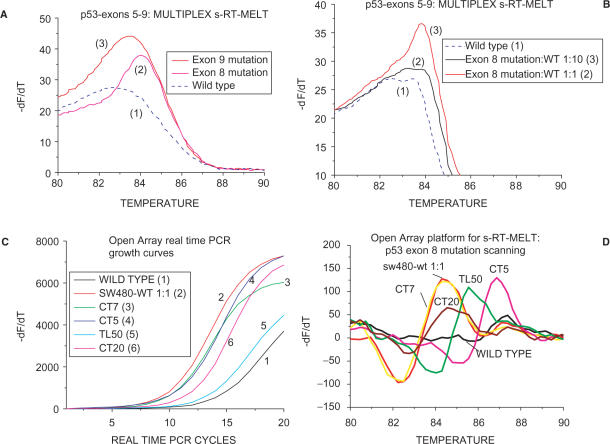
Figure 4.
Multiplex s-RT-MELT or OpenArray™-based s-RT-MELT. (A) Melting curves obtained following multiplex s-RT-MELT for mixture of p53 exons 5–9 (exon 8 mutation, curve 2) or exon 9 mutation (curve 3) or wild-type (curve 1). (B) Melting curves obtained following multiplex s-RT-MELT for mixture of p53 exons 5–9 (exon 8 mutation, curve 3) or 10-fold diluted into wild-type exon 8 mutation (curve 2) and wild-type (curve 1). (C) OpenArray™ based s-RT-MELT PCR growth curves for p53 exon 8 using DNA from lung and colon surgical specimens and cell lines. (D). Melting curves obtained following OpenArray™ based s-RT-MELT of p53 exon 8 using DNA from lung and colon surgical specimens and cell lines.

