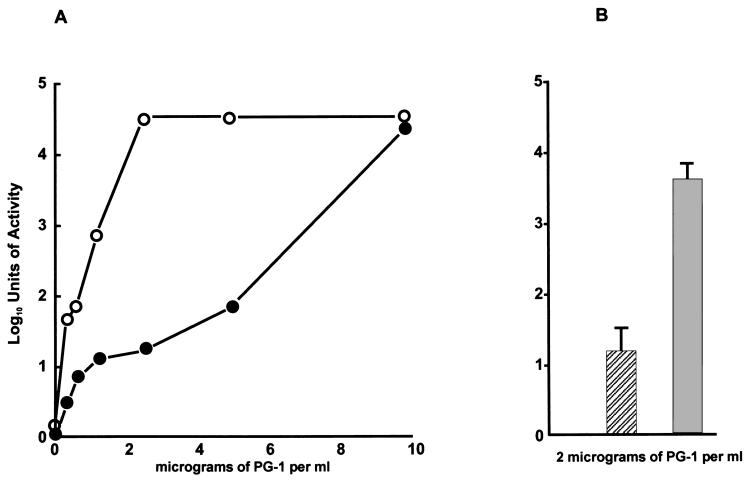
Figure 2.
The susceptibility of isogenic strains FA19 and KH14 to different concentrations of PG-1 (A) or a fixed concentration (B) of PG-1. The results (reported as log10 units of activity) with strain FA19 are shown in the solid circles (A) or hatched bar (B), whereas results with strain KH14 are shown in the open circles (A) or shaded bar (B). (A) The data are from a single experiment. (B) The data are from triplicate experiments.

