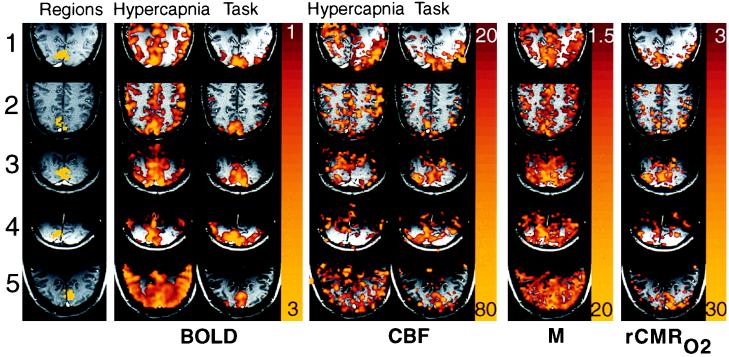
Figure 3.
Maps from trial (A) of each subject from Table 1 show regional variations. The first column shows regions of interest in yellow superimposed on an anatomical image weighted for slow flow to highlight veins: note prominent sagittal sinuses. No venous structures were seen within the regions of interest. The second and third columns show BOLD hypercapnia and task activation responses as color overlays: colors represent signal increases from 1% (red) to 3% (yellow). The fourth and fifth columns show CBF hypercapnia and task activation increasing 20% to 80%, the calibration parameter M calculated from hypercapnia data alone is shown in color from 1.5% to 20%. The right-most column shows rCMRO2 for each subject, from 3% to 30%, calculated from M and task activation images. All subjects show a confluent patch of increased rCMRO2 averaging from 13% to 19% within visual cortex. Some peaks reach up to 30% increase in metabolism, corresponding to peaks of blood flow up to 70%.

