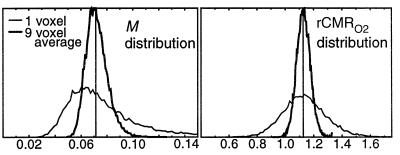
Figure 4.
Noise propagation simulation results, from Monte Carlo simulation with means and second order noise characteristics taken to match single voxel or nine voxel averages from the primary data. (BOLD and FAIR baseline SNR 100:1, FAIR perfusion signal component 4%). Although the maximum likelihood for the M estimate is skewed toward lower values, the bias is self-correcting in the estimate for rCMRO2, which shows no noise bias.

