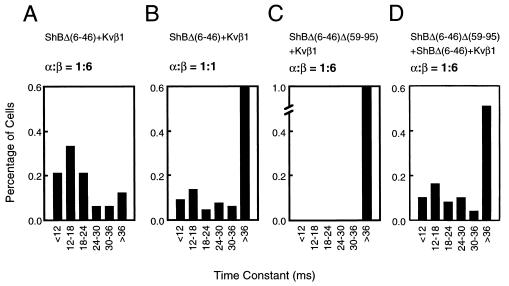
Figure 2.
Distribution of inactivation time constant of the Kvβ1-mediated inactivation of ShBΔ(6–46). The inactivation constants (horizontal axis) were plotted against cell number (in percentage of recorded cells that express Shaker current; vertical axis). The plasmid combinations and α/β ratio of individual transfections are indicated on the top of each histogram. (A) ShBΔ(6–46) (3 μg) + Kvβ1 (18 μg) (n = 33.). (B) ShBΔ(6–46) (3 μg) + Kvβ1 (3 μg) + vector (14 μg) (n = 66). (C) ShBΔ(6–46)Δ(59–95) (3 μg) + Kvβ1 (18 μg) (n = 39). (D) ShBΔ(6–46) (1 μg) + ShBΔ(6–46)Δ(59–95) (2 μg) + Kvβ1 (18 μg) (n = 49).

