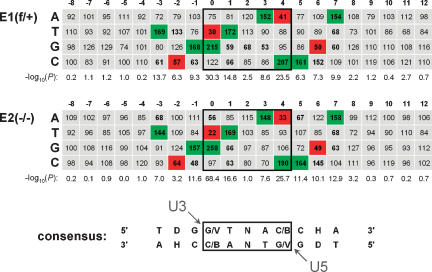
Figure 6.
The local HIV-1 integration site consensus sequence is preserved in Ledgf-null cells. Tabulated is the percent expected nucleotide frequency at each position. The position 0 nucleotide was joined to the processed U3 end of the LTR. Nucleotide sequences for positions 0–12 were experimentally determined by sequencing; those for positions −8 to −1 were assumed from genomic sequences upstream of mapped integration sites. Positions 0–4, which become duplicated following integration and gap repair, are boxed. Statistical significance, expressed as −log10(P), was calculated for the difference between observed and expected nucleotide frequency at each position. Frequencies <70% or >130% at positions with P < 0.001 are shown in bold; those that were used to derive the consensus are highlighted in green (>130%) or red (<70%). The arrowheads indicate the nucleotides within the target consensus sequence that become joined to the U3 and U5 ends of proviral DNA. (D) A, G, or T; (V) A, C, or G; (B) G, C, or T; (H) A, C, or T.

