
Figure 2.
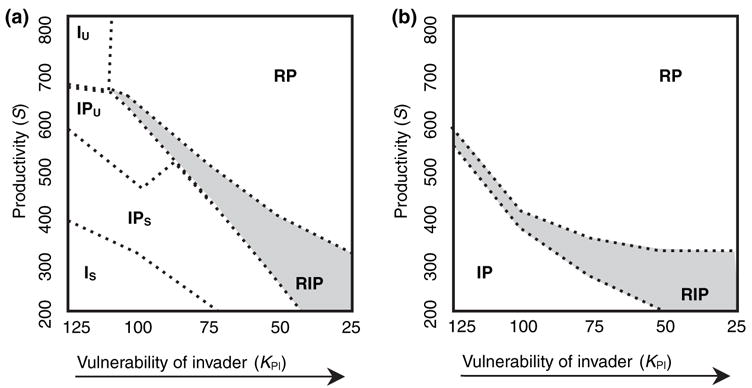
Simulations of invasion of a stable predator–prey system by a superior competitor, illustrating the sensitivity of the outcome to the invader’s vulnerability to predation (increasing vulnerability with decreasing KPI) and environmental productivity (S), the maximal resource availability for the micro-organism population. Simulations ran for 30 000 time steps with the invader invading at time 2000. Parameters are in arbitrary units so results only illustrate the qualitative trends expected in this system. Letters on the graph indicate species combinations attaining stable coexistence (I = invader, R = resident, P = predator, subscript S = stable oscillations, subscript U = unstable expanding oscillations; e.g., RP = resident + predator). Shaded regions indicate combinations of KPI and S where the presence of the predator fosters coexistence of competing resident and invader via a keystone predator effect. (a) Competitive advantage of invader is large (KI = 100, KR = 600). (b) Competitive advantage of the invader is small (KI = 300, KR = 600).