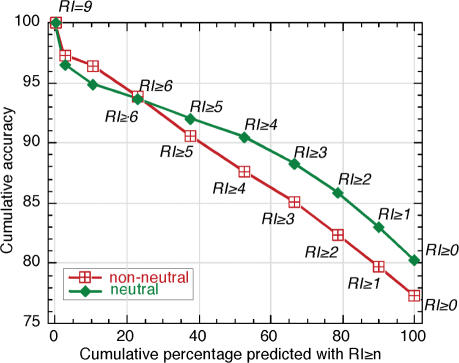
Figure 2.
Stronger predictions more accurate. Stronger SNAP predictions were more accurate. This allowed the introduction of a reliability index for SNAP predictions [Equation (6)]. This index effectively predicted the accuracy of a prediction and thereby enables users to focus on more reliable predictions. The x-axis gives the percentage of residues that were predicted above a given reliability index. The actual values of the reliability index (RI) are shown by numbers in italics above the curve for neutral mutations (green), and below the curve for non-neutral mutations (red). The values for 7 and 8 are not explicitly given to avoid confusion. The y-axis shows the cumulative percentage of residues correctly predicted of all those predicted with RI ≥ n [accuracy, Equation (2)]. Curves are shown for SNPs with neutral (green diamonds) and non-neutral (red squares) effects. For instance, ∼38% of both types of residues are predicted at indices ≥5; of all the non-neutral mutations predicted at this threshold, about 90% are predicted correctly, and of all the neutral SNPs about ∼92% are predicted correctly.

