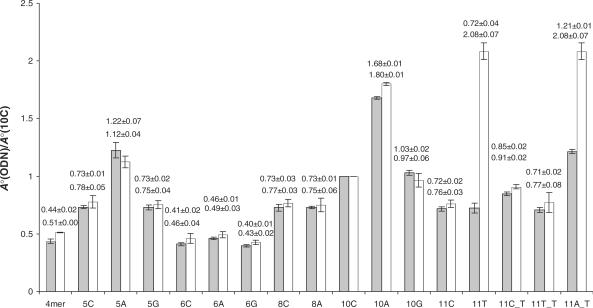
Figure 3.
Ratios of peak areas of individual ODNs to that of 10C in the mixture based on the SIC (solid bar), and based on TIC (open bar). All authentic ODNs were identified from the replication mixture of 2-AP-6-SO3H-containing substrates induced by yeast pol η. Error bars represent the standard deviations of results from three independent experiments. The top and bottom numbers listed above the bars are data obtained from SICs for three abundant fragment ions and based on TICs for the most abundant molecular ion, respectively.

