Figure 1.
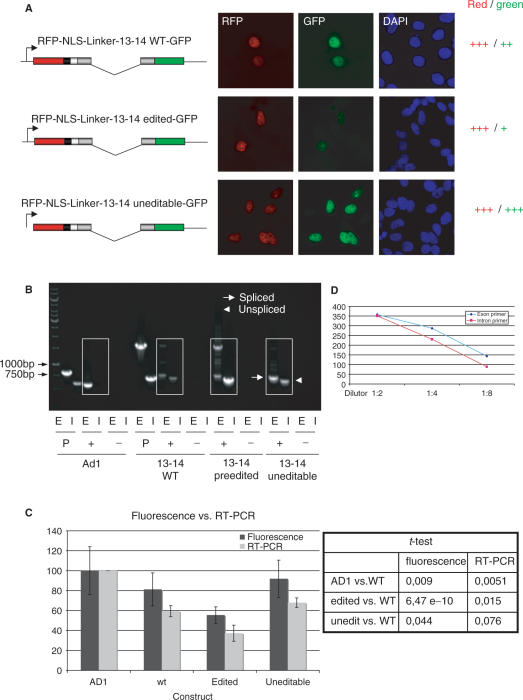
Analysis of splicing efficiencies of wild-type and mutant R/G constructs. (A). Microscopic images of HeLa cells transfected with wild-type, ‘pre-edited’, and uneditable R/G constructs. The constructs are indicated next to each picture series. RFP and GFP fluorescence is shown in red and green, respectively. DNA is stained with DAPI (blue). A ‘pre-edited’ R/G shows reduced fluorescence in the GFP channel when compared to wild-type or uneditable R/G constructs, suggesting impaired splicing efficiency. Scale bar: 10 µm. (B) RT-PCR analysis of cells transfected with Ad1, wild-type R/G, ‘pre-edited’ R/G, and uneditable R/G fragments. Exonic (E) and intronic (I) primers were used to selectively amplify spliced and unspliced products. Arrow: PCR product derived from the spliced product; Arrowhead: PCR product derived from the unspliced product. Constructs are indicated below the respective lanes. P: plasmid positive control; +: with RTase; −: without RTase. To allow quantification of PCR products and to avoid saturation of the PCR reactions, only 23 cycles were run. The high molecular band obtained with exonic primers in the pre-edited construct reflects the unspliced primary RNA and results from the poor splicing of this construct. (C) Bar diagram representing the averaged results of 3 RT-PCR experiments (light gray bars) and 100 fluorescent cells analyzed by quantitative microscopy (dark bars). In both assays, a ‘pre-edited’ R/G-containing fragment (edited) showed reduced splicing. Splicing efficiency of Ad1 was set to 100%. A student's t-test indicates that the observed differences are significant (P-value < 0.05). (D) Quantified band intensities of RT-PCRs with different DNA dilutions are plotted. The linear relationship between the different DNA dilutions are shown for each primer pair. A 1:4 dilution was used for the RT-PCR in (B).

