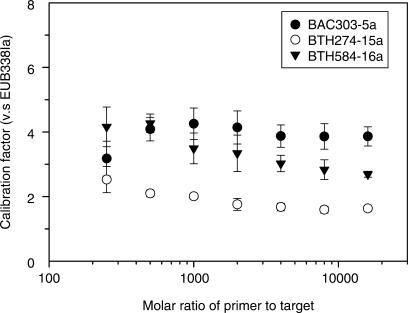
Figure 6.
Distribution of the ratios for the labeled primer BAC303-5a (filled circle), BTH274-15a (open circle), and BTH584-16a (filled inverted triangle) against the labeled universal primer EUB338Ia. The primer-to-target ratios (molar basis) range from 250 to 16 000. The experiment is conducted using fixed primer concentrations, and varying target concentrations as indicated in the main text. The data points represent the average values derived from three independent reactions. The error bars represent standard deviation for average data points.

