
Figure 2.
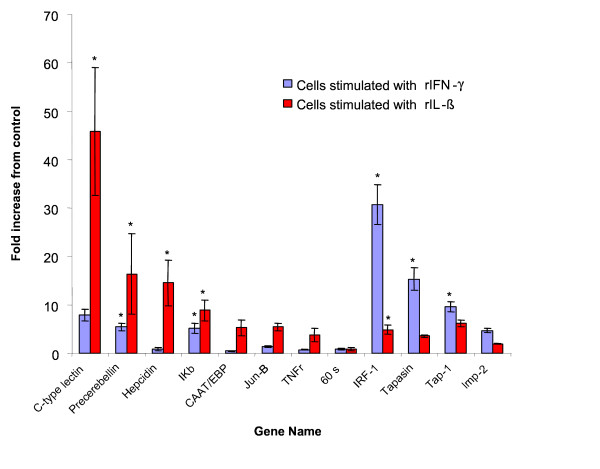
Real time PCR results on 6 h mRNA samples that had been used for microarray analysis. Each selected gene was examined for expression following 6 h stimulation with either trout rIL-1β or trout rIFN-γ. The expression of each gene was normalised to β-actin. The real time PCRs were all performed in triplicate and are shown as mean ± SEM. (* indicates the increase in expression compared to control is significant by t test P < 0.05). Genes were ordered in relation to largest fold increase induced by rIL-1β or rIFN-γ with the 60S ribosomal protein not showing induction by either cytokine.