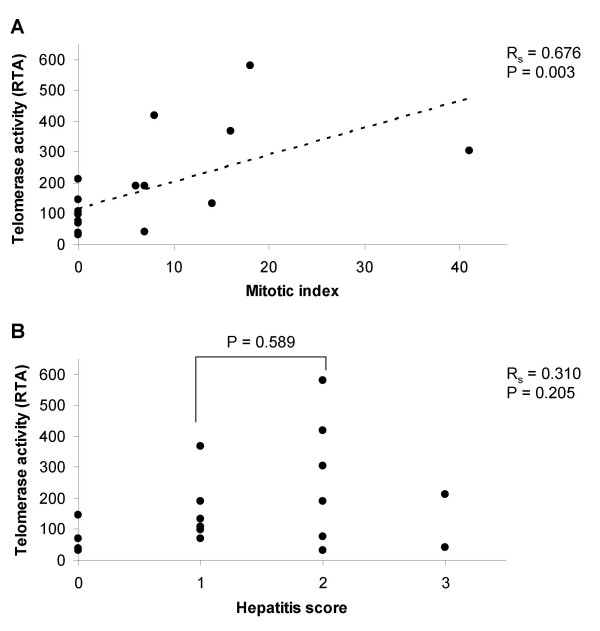
Figure 4.
Correlation of mitotic indices and hepatitis scores to telomerase activity. Mitotic indices (A; n = 17) and hepatitis scores (B; n = 17) were correlated to the relative telomerase activity per μg protein (RTA) in x-y plots by adding linear trendlines. Association was tested with the Spearman rank correlation (RS) considering P < 0.05 significant. Histological assessment is not available for one PH animal. In a subgroup analysis, RTA levels in animals with hepatitis score 1 were compared to animals with hepatitis score 2 (Mann-Whitney U test, P < 0.05 considered significant).

