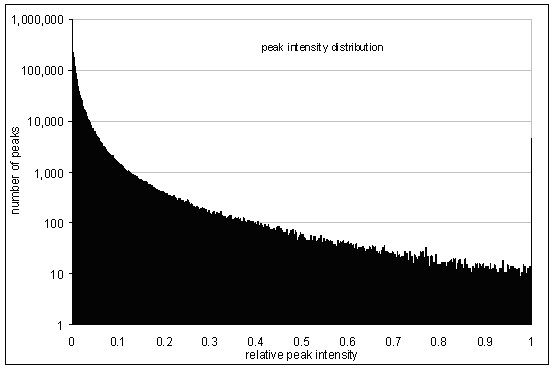
Figure 1.

Peak intensity distribution from product ion spectra. 70% of all fragment peaks have a relative intensity less or equal 0.02. The peak on the right hand side originates from the prior scaling of all spectra to a maximum peak intensity of 1.
