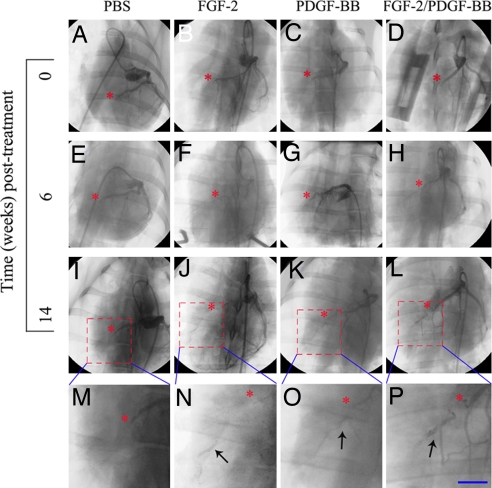
Fig. 2.
Angiographic analysis of ischemic myocardium treated by various factors. Angiography was performed on myocardium treated with PBS (A, E, I, and M), FGF-2 (B, F, J, and N), PDGF-BB (C, G, K, and O), or FGF-2 and PDGF-BB together (D, H, L, and P) at day 0 (A–D), week 6 (E–H), and week 14 (I–P). Asterisks indicate the LAD coronary artery ligation sites. Arrows indicate the newly established vascular networks downstream from the ligation sites. (Scale bar: 10 μm.)

