
Figure 2.
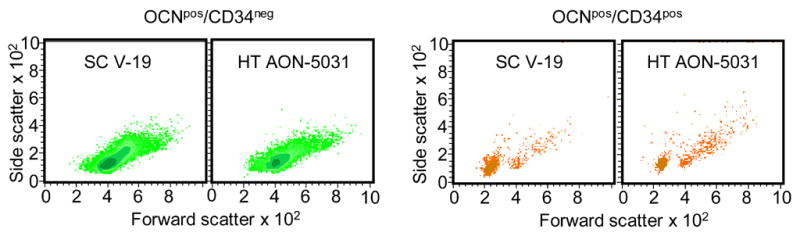
Analysis of cell phenotypes using the SC V-19 anti-OCN and anti-CD34 antibodies. OCNpos cells were first isolated using MACS, then stained with the anti-CD34 antibody, and subsequently analyzed by FACS. OCNpos/CD34neg and OCNpos/CD34pos cells were then back-gated to analyze their forward/side scatter characteristics, with higher forward scatter indicating larger size and higher side scatter indicating more granularity. Shown are density plots, with darker color representing more cells.