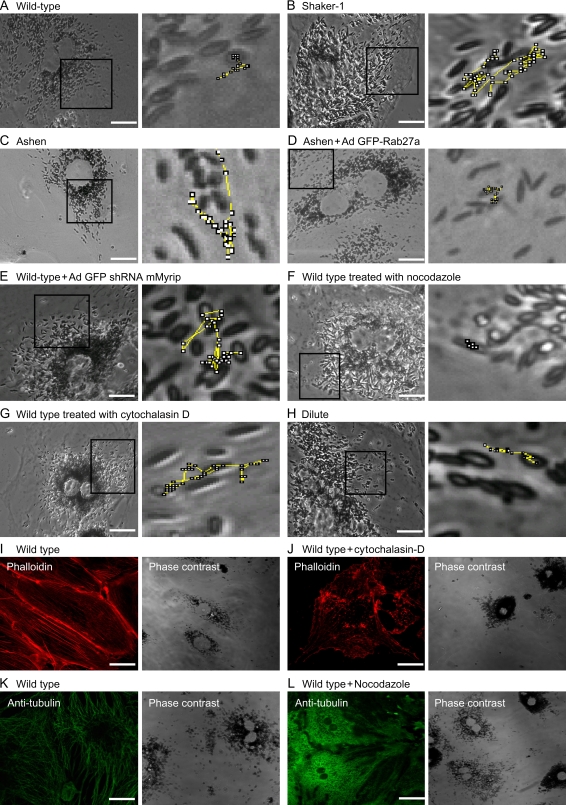
Figure 4. Live-cell imaging of RPE primary cultures and distribution of MTs and actin filaments.
Phase contrast images of primary RPE cells at high magnification (× 100) are shown. Zoomed images showing representative trajectories drawn during the entire time frame collected during live-cell imaging illustrates the movement of melanosomes in representative wild-type RPE cell (A), shaker-1 RPE cell (B), ashen RPE cell (C), ashen RPE cell transduced with Ad GFP-Rab27a (D), wild-type RPE cell transduced with Ad shRNA5 Myrip (E), wild-type RPE cell treated with nocodazole (F) or cytochalasin D (G) and dilute RPE cell (H). Regions used for the movies are marked for each case. Wild-type murine RPE cells were fixed, permeabilized and labelled with phalloidin (I) or anti-tubulin (K), as indicated. Cells treated with 10 μm cytochalasin D were also stained with phalloidin (J), while cells incubated with 10 μm nocodazole were labelled with anti-tubulin (L). Bar = 20 μm.

