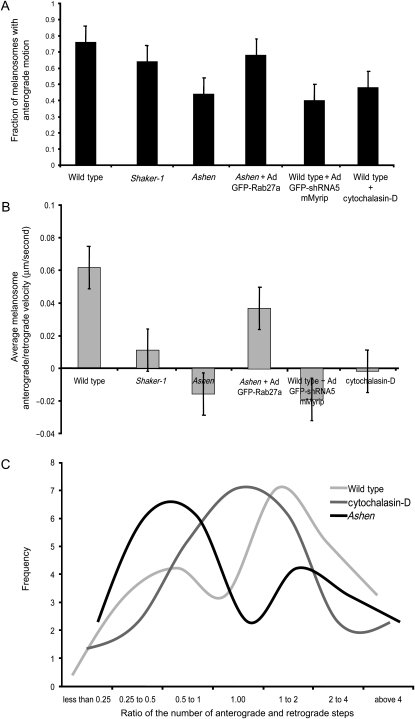
Figure 6. Melanosome motion directionality.
Histograms representing the fraction of melanosomes with centrifugal movement (A) and average melanosome anterograde/retrograde velocity (μm/second) (B) are shown for the indicated RPE cultures (mean ± standard deviation). C) Frequency of the ratio of number centrifugal/centripetal steps performed in a population of 25 melanosomes during a 30-second period.

