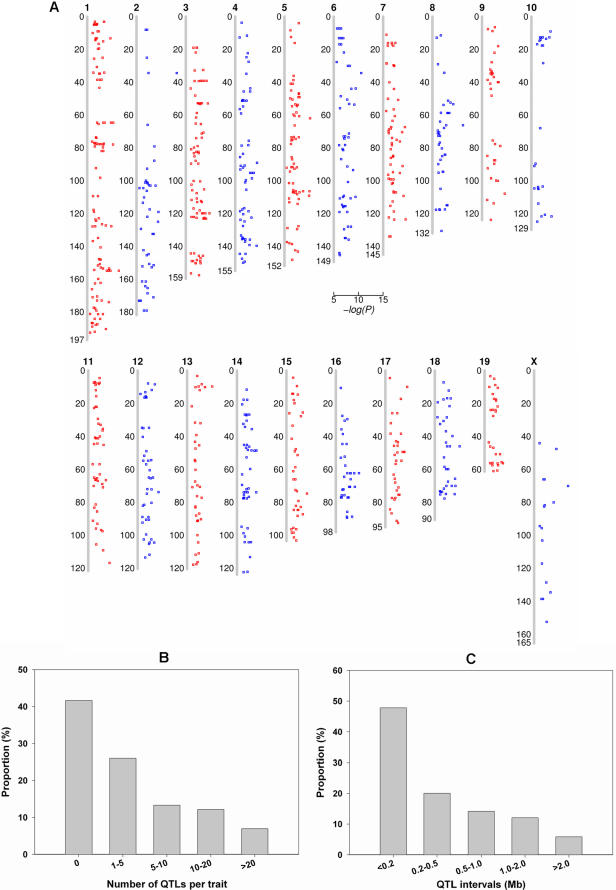
Figure 2. 937 QTLs identified by genome-wide association analysis.
(A) Distribution of 937 QTLs on the mouse genome. The scatter plots were drawn for –log(P) against the peak of QTLs on the chromosomes. Each square represents an identified QTL. (B) The number of QTLs per trait. (C) Proportion of QTL intervals in Mb.

