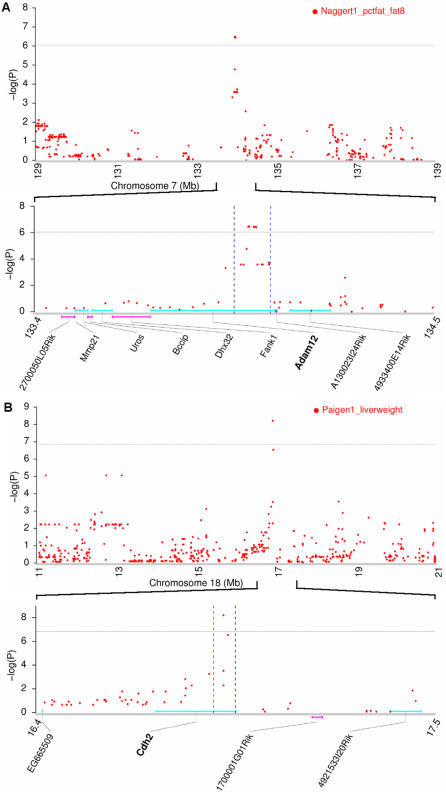
Figure 5. Adam12 and Cdh2 were mapped to single-gene resolution.
(A) Adam12 is associated with the percent of fat mass after 8 weeks on an atherogenic diet (Naggert1_pctfat_fat8). (B) Cdh2 is associated with liver weight after 8 weeks on an atherogenic diet (Paigen1_liverweight). Relevant phenotypes for these two genes were already observed in murine knockout or transgenic models. In each subfigure, the upper panel is the enhanced view of LD mapping in a short region around the LD peak, and the lower panel is the physical map of the associated refined QTL. Genes shown on the upper side of the chromosome (turquoise lines) are transcribed in the–orientation (from right to left), and those on the lower side (pink lines) in the+orientation (from left to right). The horizontal gray lines indicate genome-wide empirical thresholds. Physical position was based on the latest NCBI mouse genome build 36.1.

