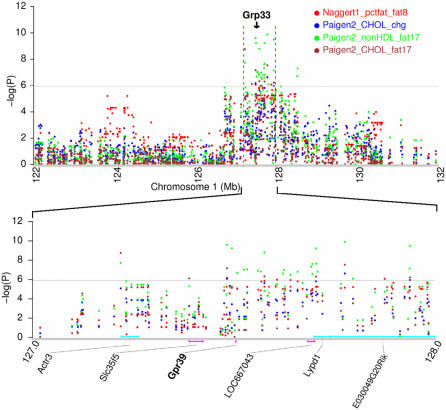
Figure 6. Gpr39 was mapped in a pleiotropic QTL.
Gpr39 is associated with percent of tissue mass that is fat after 8 weeks on atherogenic diet (Naggert1_pctfat_fat8), total cholesterol after 17 weeks on atherogenic diet (Paigen2_CHOL_fat17), fold change in total cholesterol after 17 weeks on atherogenic diet (Paigen2_CHOL_chg), and non-HDL cholesterol after 17 wks on atherogenic diet (Paigen2_nonHDL_fat17). Gpr39 has knockout phenotypes on both obesity and blood cholesterol levels.

