
Figure 5. Tenascin and CLP expression is altered in Sox9flox/flox;Tie2-cre mice.
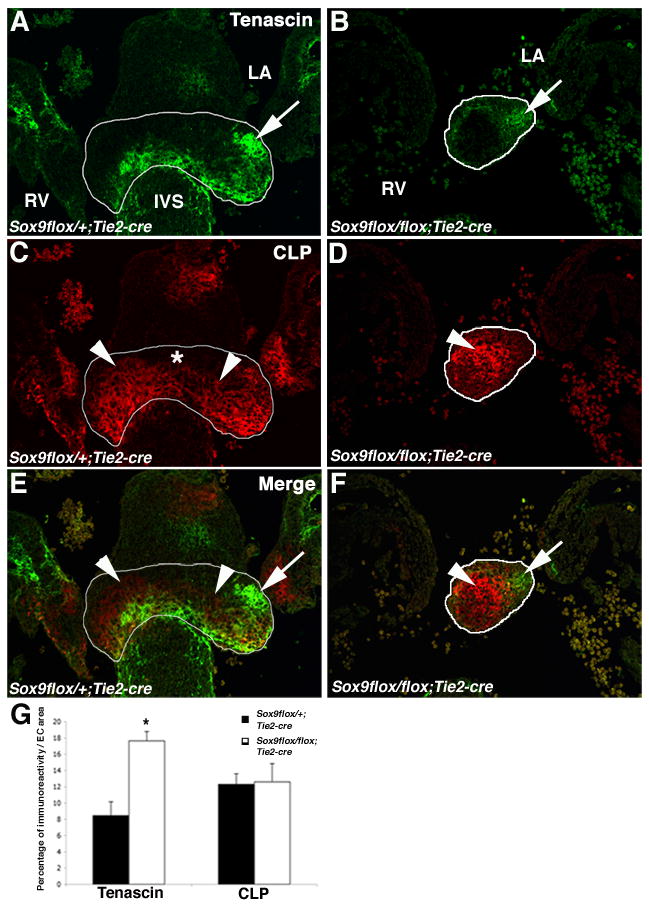
(A, B) Immunofluorescence staining of tenascin (A, B) and CLP (C, D) were used to show ECM protein expression in tissue sections of ECs (highlighted by white lines) from Sox9flox/+;Tie2-cre (A, C, E) and Sox9flox/flox;Tie2-cre (B, D, F) mice at E12.5. Tenascin-positive regions are indicated by arrows and CLP-positive regions are indicated by arrowheads. (D) The atrial aspect of the central EC where CLP is not expressed is indicated by (*). Merged images from (A-D) are shown in (E, F). The percent area of the immunoreactivity of CLP and tenascin within the central EC is reported in (G). Error bars represent standard error of the mean, and statistical significance (*) is calculated by Student’s t-test compared to Sox9flox/+;Tie2-cre mice (P<0.05; n=3). IVS, interventricular septum; LA, left atrium; RV, right ventricle.