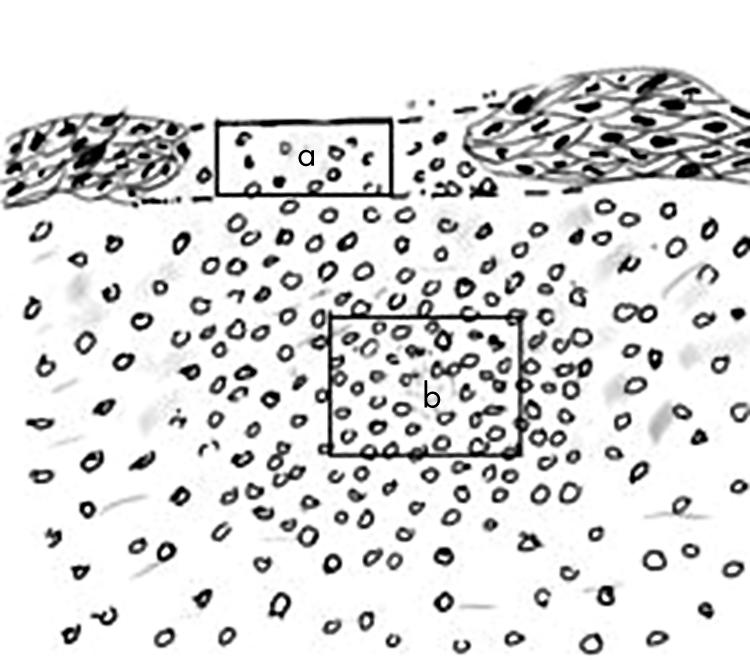
Figure 1.

Schematic diagram of superficial (a) and stromal (b) areas counted for cell infiltrate. “a” had the same width as “b”, but its height varied according to the thickness of the adjacent epithelium. Counts were adjusted to number per 0.04 mm2 (the size of the image analysis screen). “b” was 0.04 mm2 and located in the area of maximum infiltrate.
