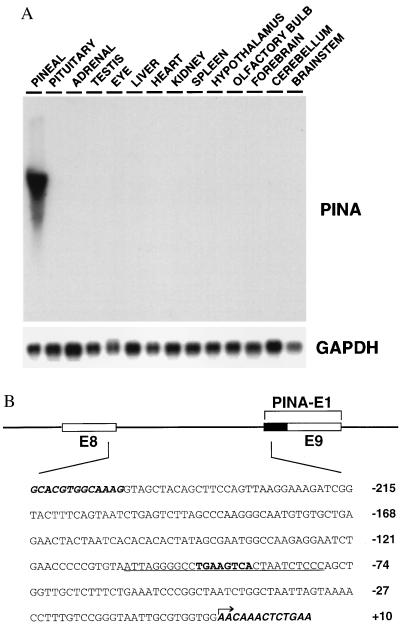
Figure 1.
Tissue specificity of PINA and its upstream intronic sequence. (A) Northern blot analysis of a panel of rat tissue total RNAs (10 μg each) at night (02:00) with PINA cDNA as probe. Equal loading and quality of RNAs were confirmed by glyceraldehyde-3-phosphate dehydrogenase (GAPDH) controls. (B) The PINA upstream intronic sequence. Schematic representation of the exon-intron organization of the PINA upstream region. Open boxes represent exons 8 and 9 of the rat Atp7b gene. The black box represents the part of the PINA exon 1 that belongs to intron 8 in Atp7b gene. The DNA sequence shown includes the PINA intronic promoter and small portions of flanking exons (bold italic). The arrow indicates the most upstream transcription initiation site as determined by primer extension and 5′-rapid amplification of cDNA ends (data not shown). The 28-bp sequence used as probe for EMSA (Fig. 2A) is underlined with the CRE in bold.

