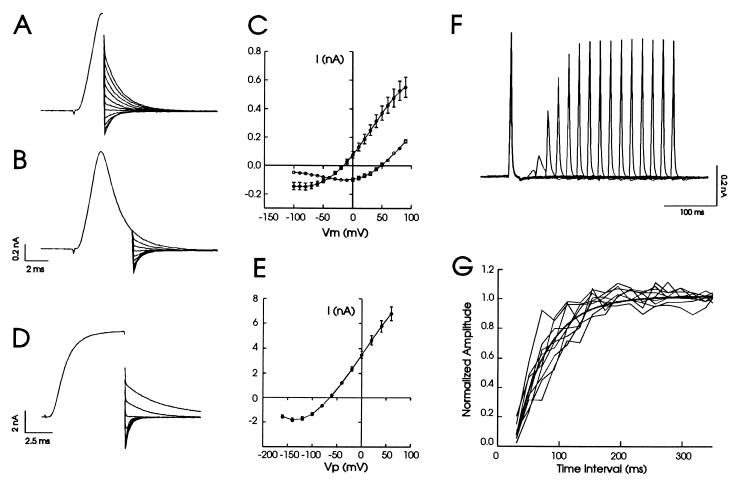
Figure 3.
The shift in the reversal potential associated with depletion of K+ and time course of K+ refill from cell body to vesicle. After a single voltage step from −50 to +90 mV, the transmembrane potential (Vm) was stepped to voltages ranging from −100 to +90 mV at the peak of the current (A) or at 5 ms after onset of voltage step. (B). Eleven tail traces around reversal potential are shown in each case, and the initial part of the current preceding tail currents are averaged and shown as a single trace for clarity. (C) A plot of the amplitudes of tail currents at the peak (solid circles, reversal potential −20 mV) and at 5 ms after onset of voltage step (open circles, reversal potential +50 mV) against individual repolarizing voltages. These curves were generated by paired comparisons in the same cells (n = 8). (D) Tail currents recorded in whole-cell configuration by using similar protocol as in A and B except the initial voltage step was from −70 to +40 mV and repolarizing voltages ranged from −160 to +60 mV. The holding potential was 0 mV for A and B and −70 mV for D. (E) A plot of the amplitude of whole-cell tail currents against repolarizing voltages revealed a reversal potential of −70 mV. Data from 14 cells were pooled to construct this graph. (F) An example recording using double-pulse protocol showed that as the interval between the first and second test pulse (20.5 ms per each pulse) was increased the current amplitude increased. Fifteen separate sweeps were superimposed. (G) The current amplitude to the second test pulse was normalized to that of the first test pulse and plotted against the time interval between two pulses. The smooth curve represents single exponential fit to the averaged data from nine cells. The time constant was 51.3 ± 4.9 ms.

