
Figure 2.
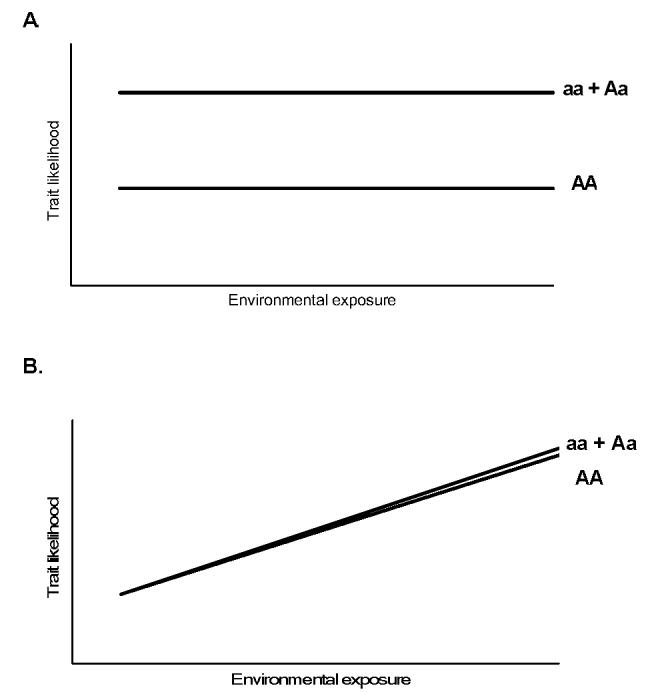
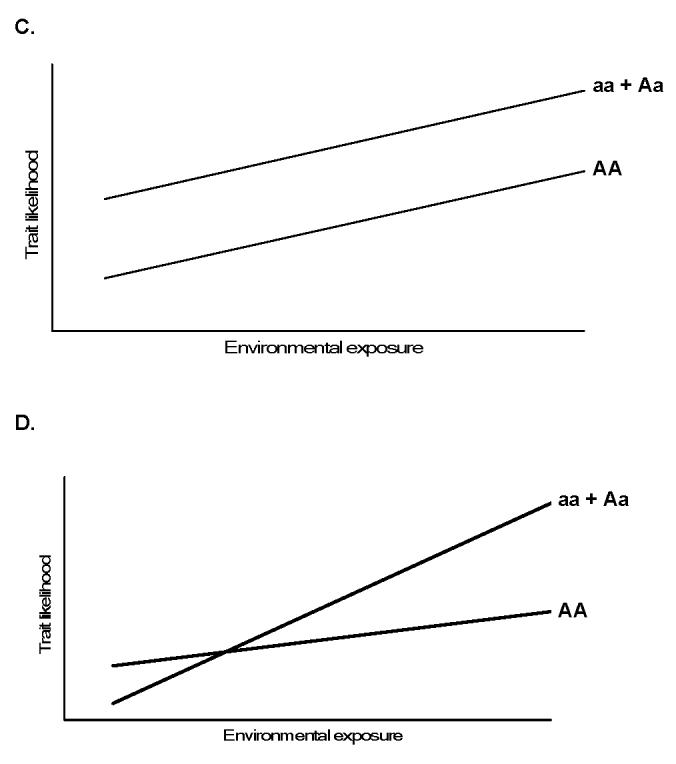
Theoretical gene-environment relationships. Panels A and B depict diseases influenced only by the gene or environmental variable, while Panel C demonstrates an additive relationship for a dominant mutation “a” with environmental exposure modeled as a continuous variable. Panel D, a true (biologic) gene-environment interaction, where the effect of the genotype is variably influenced by the exposure. Modified from [18].