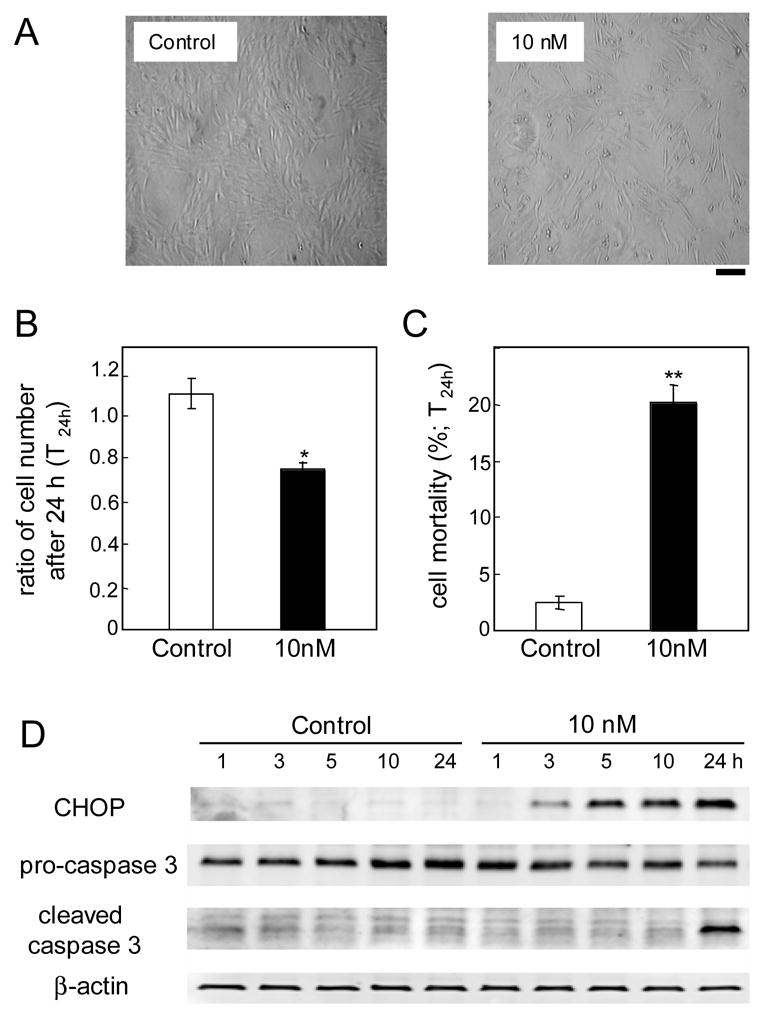
Figure 2.

Apoptotic cell death for continuous Thapsigargin treatments in MC3T3 cells. (A) Cellular images. Black bar = 100 μm. (B) Ratio of cell numbers 24 h after a continuous treatment. (C) Ratio of the number of dead cells with respect to the total number of cells. (D) CHOP, pro-caspase 3, and cleaved caspase 3 proteins in response to 10 nM Thapsigargin.
