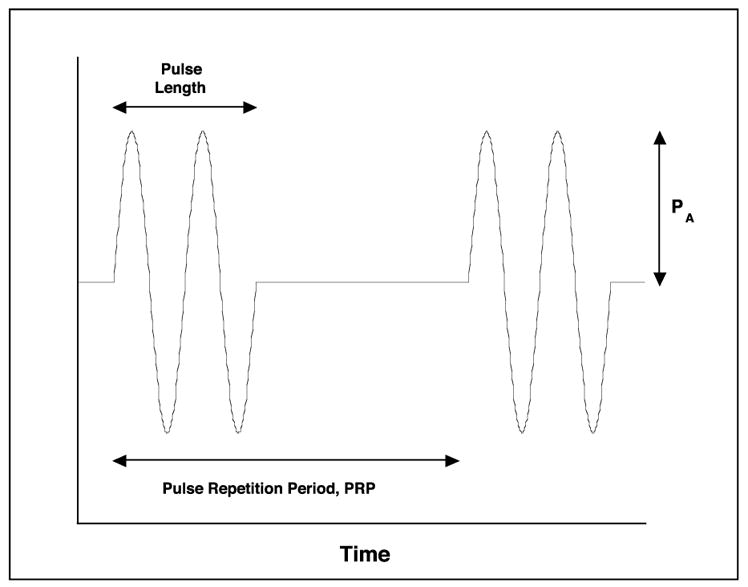
Figure 2-2.

A series of two idealized acoustic pulses of pressure amplitude PA, plotted as a function of time, t. The curve shows the acoustic pressure as it varies in time at a fixed position. It is important to realize that measurements of actual acoustic pulses often show the effects of nonlinear distortion depicted in Figure 2-1.
