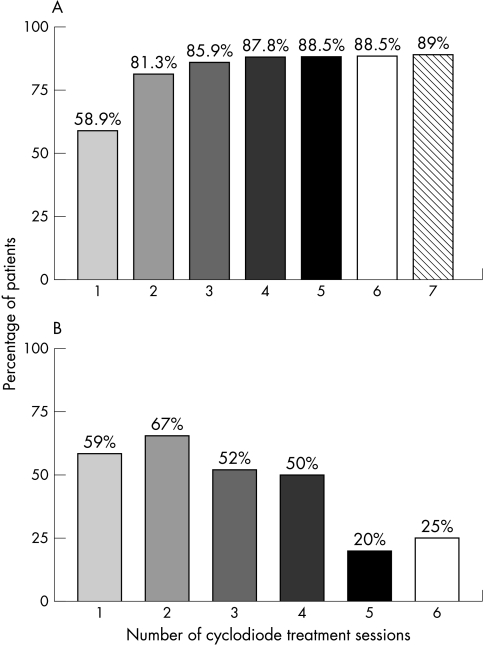
Figure 3.
Response rate for cyclodiode therapy. (A) shows the percentage of patients achieving an adequate response (IOP<22 mm Hg or a drop in IOP>30%) following each additional treatment episode—that is, the cumulative response rate. (B) shows the response rate for each individual treatment episode.

