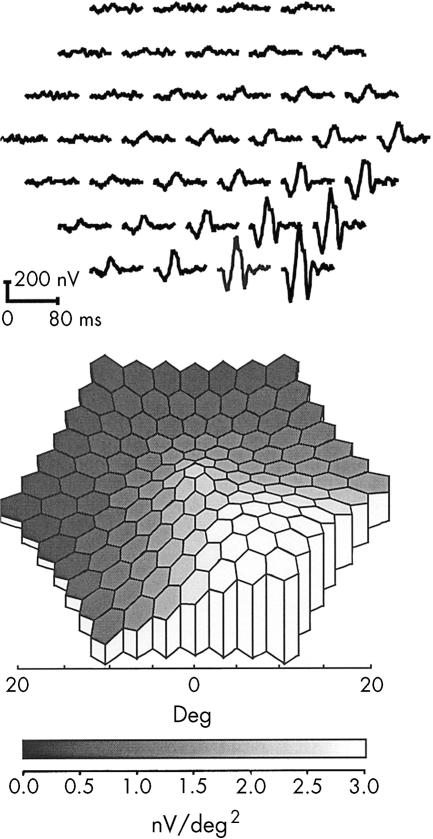
Figure 2.
(Upper panel) Trace array of multifocal ERGs (mfERGs) of the right eye showing marked depression in the superior retinal areas. Waveforms that are close to “extinguished” within the lesion are one of the characteristics of mfERGs in AZOOR. Recorded with: length of m-sequence, 214–1; base rate, 75 Hz; flash intensity, 2.67 cd/s/m2; band pass filter, 10–300 Hz; and artefact removal procedure, one iteration (0–80 ms on the first order kernel). (Lower panel) The 3D topographic plot translated from the trace array shown above showing functional distribution of the retina corresponding to the visual field defect.

