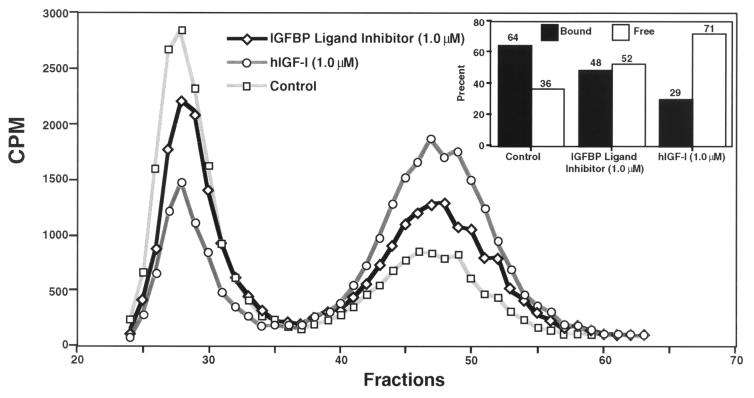
Figure 2.
Gel-filtration analysis of rat CSF showing the relative proportions of bound and “free” [125I]hIGF-I dissociated by IGF-I or the IGFBP ligand inhibitor. The Sephadex G-50F gel-filtration profiles of rat CSF in the absence (Control) or presence of hIGF-I [hIGF-I (0.1 μM)] or 1.0 μM of [Leu24,59,60, Ala31]hIGF-I [IGFBP Ligand Inhibitor (1.0 μM)] are shown. The quantified data representing the relative proportions of the hIGF-I/IGFBP complex (Bound) and “free” hIGF-I (Free) are presented in the Inset.

