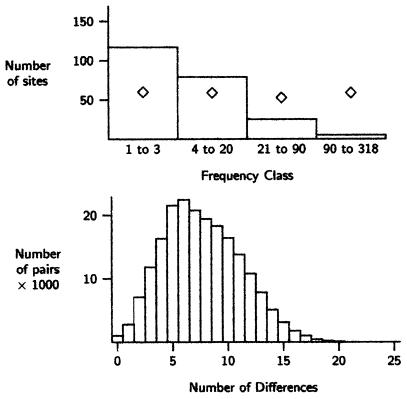
Figure 7.
Frequency spectrum and mismatch distribution from a world sample of 636 mtDNA sequences at 411 positions of the first hypervariable segment (HVS-I). Compare this with Fig. 5. The diamonds show the expected number of segregating sites in each frequency interval expected in a constant size population.

