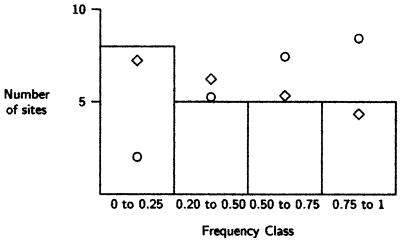
Figure 9.
Frequency spectrum of 23 Alu insertions in humans. The diamonds show the expected numbers of loci under constant population size as specified by the long-neck model. Circles show expected numbers of loci under the hourglass model of a population contraction. The hourglass hypothesis can be rejected by a statistical test, whereas the long-neck model cannot. Each of these was ascertained in a diploid. The probability of detecting at least one copy of an insertion in a diploid whose population frequency is x is x2 + 2x(1 − x), the ascertainment function for this system. Expected values for the long-neck model were computed by multiplying the distribution in Eq. 2 by this function. Expected values for the hourglass model were computed by multiplying the ascertainment function by the uniform distribution because the distribution of the number of copies of a mutation in the top interval of the tree is uniform.

