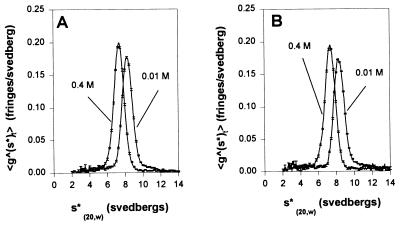
Figure 4.
Apparent sedimentation coefficient distributions for myosin fragments. Sedimentation velocity was determined in solutions containing 2 mM MgCl2, 0.3 mM DTT, 1 mM ATP, 20 mM Tris·HCl (pH 7.5), 0.1 mg/ml myosin fragment, and either 0.01 M or 0.4 M KCl. The velocity runs were carried out at 56,000 rpm at 20°C for smooth HMM (A) and chimeric myosin (B). The x axis,  is the apparent sedimentation coefficient computed as described by Stafford (30, 31).

