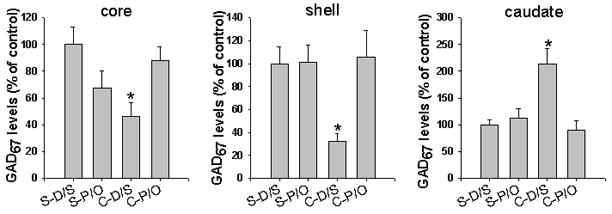
Figure 1. Expression of enzyme GAD67 in the NAc and caudate.

Blots were scanned and the densities under the peaks corresponding to total immunoreactivity of GAD67 and α-tubulin were determined. See Methods for descriptions of the experimental groups. *, p < 0.05, cocaine (C-D/S) vs saline group (S-D/S) in the core and vs all other groups in the shell and caudate; N= 6 rats/group.
