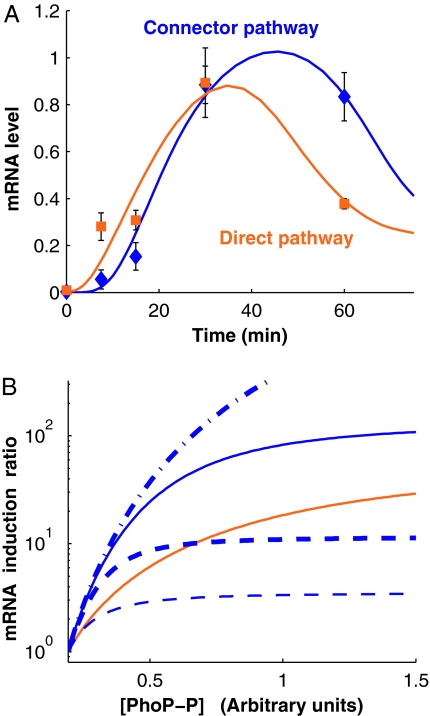
Fig. 3.
Modeling of the connector-mediated and direct pathways. (A) The connector-mediated pathway of wild-type S. enterica exhibits an initial delay for activation compared with the direct pathway. mRNA levels of pbgP gene in wild-type S. enterica and in the engineered strain with the direct pathway (EG17344) after bacteria were grown in noninducing (i.e., 10 mM MgCl2) conditions for 4 h and then grown for the indicated times after they were switched to inducing conditions (i.e., 20 μM MgCl2). The value at time 0 corresponds to the time the organisms were switched to inducing conditions. The experimental data corresponding to the direct and connector-mediated pathways are presented as orange squares and blue diamonds, respectively, whereas solid lines indicate trajectories for models fitted as described in Materials and Methods. (B) Expected steady-state induction ratios for the pbgP mRNA as a function of phospho-PhoP concentration ([PhoP-P]) for the two pathways computed by using the fitted models (solid lines; color coding as in A). The key roles played by the rates of PmrD production and PmrA-P–PmrD complex formation is demonstrated by their distinct behavior upon modification of the values for these parameters. The curves corresponding to scenarios with a 10-fold increase in the rates of PmrD production and PmrA-P–PmrD complex formation are shown by thin and thick dashed lines, respectively. The curves corresponding to scenarios with a 10-fold decrease in the rates of PmrD production and PmrA-P/PmrD complex formation are shown by thin and thick dash-dot lines, respectively; in the figure, the latter two lines coincide.

