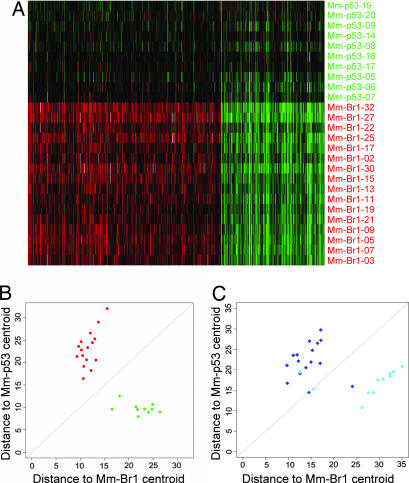
Fig. 5.
Supervised classification of mouse mammary tumors. (A) Expression data matrix of 646 BRCA1 reporter genes from a training set containing 16 Brca1Δ/Δ;p53Δ/Δ carcinomas (red) and 10 p53Δ/Δ carcinomas (green). Each row represents a tumor, and each column represents a gene. (B) Supervised classification of individual tumors from the training set according to their Euclidean distances to the centroids of mouse Brca1Δ/Δ;p53Δ/Δ mammary tumors and p53Δ/Δ tumors, respectively. (C) Supervised classification of an independent validation series containing 16 Brca1Δ/Δ;p53Δ/Δ tumors (dark blue diamonds) and 11 p53Δ/Δ tumors (light blue diamonds). Most mammary tumors in the validation series (23/27) were correctly classified by the 646 reporter genes.

