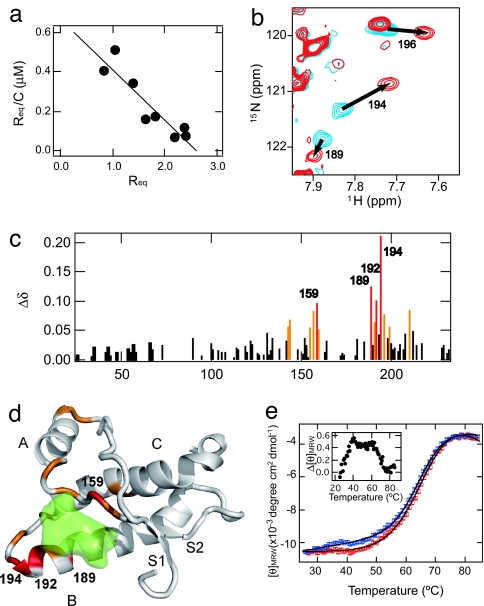
Fig. 2.
Interaction of an anti-prion compound, GN8, and a recombinant mouse PrPC. (a) Scatchard plot (Req vs. Req/C, where Req and C are the equilibrium response of SPR and the concentration of GN8, respectively) of the specific binding of GN8 with the PrP obtained by a surface plasmon resonance sensorgram. From the slope of the line, Kd was estimated to be 3.9 μM. (Details are shown in SI Fig. 5 and SI Methods.) (b) An overlay of the 1H-15N heteronuclear single quantum coherence NMR spectra of PrP in the absence and presence of GN8. Blue contours show the spectrum of PrPC without GN8, and red contours show the spectrum in the presence of 1.0 mM GN8 at pH 4.5. (c) Plot of the weighted averages of the 1H and 15N chemical shift changes, calculated by using the function Δδ = [(Δδ1H)2 + 0.17(Δδ15N)2]1/2 against the residue number. The absence of bars in the plot indicates unassigned residues, proline residues, or unmeasured shifts due to resonance overlaps. Perturbed residues with Δδ values of >0.9 ppm are shown in red, and those with 0.9 > Δδ > 0.5 ppm are in orange. (d) Mapping of the perturbed residues on the structure of mPrP(121–231) (PDB entry 1AG2). The perturbed residues with Δδ values of >0.9 ppm are shown in red, and those with 0.9 > Δδ > 0.5 ppm are in orange. Binding pocket is overlaid in green. S1, A, S2, B, and C indicate S1 strand, helix A, S2 strand, helix B, and helix C, respectively. The image was created by using PyMol. (e) Thermal unfolding profiles of recombinant mouse PrP (amino acids 23–231, 5 μM) without (blue) or with (red) GN8 (10 μM). CD intensities of PrP in the presence of GN8 were normalized to those of PrP without GN8, and fitted curves (see SI Methods) are also shown. Binding with GN8 stabilizes the conformation of PrPC. (Inset) The difference in extinction coefficients at 222 nm of PrP without GN8 and those in the presence of GN8, as a function of temperature.

