Fig. 3.
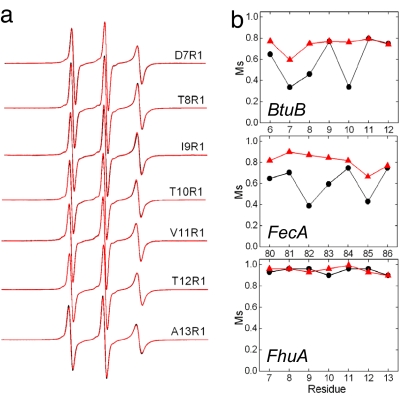
Ton box dynamics in FhuA, BtuB, and FecA. (a) X-band EPR spectra of single sites labeled with R1 (Fig. 2a) along the FhuA Ton box (residues 7–13) without (black line) and with (red line) the substrate ferrichrome. In every case the spectra from apo and ligand-bound states overlap. (b) A plot of the Ms obtained from the EPR spectra of R1 when placed along the Ton box in the absence (●, black) and presence (▴, red) of substrate for BtuB, FecA, and FhuA. The Ms is defined as Ms = (δ−1 − δi−1)/(δm−1 − δi−1), where δ is the central resonance linewidth and δi and δm are the least and most mobile R1 side chains found in proteins (42). Values for δi and δm were taken as 8.5 and 1.8 G, respectively.

