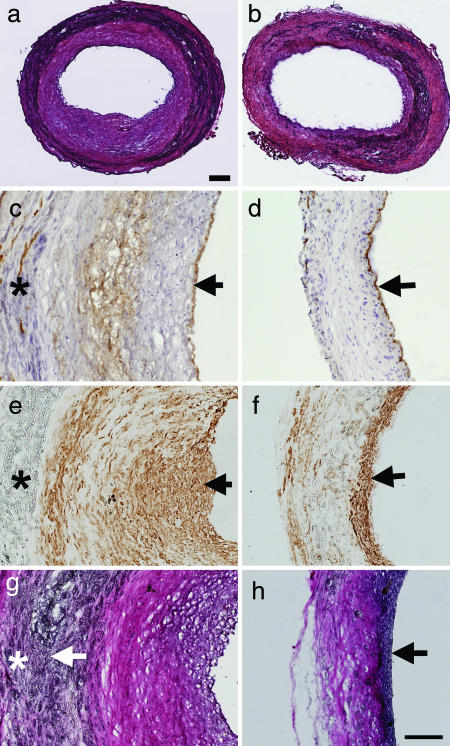
Fig. 2.
Cell organization and ECM remodeling after 60 d for acellular and cellular small-diameter nanofibrous vascular grafts. Images are representatives from at least three independent samples. (a and b) Hematoxylin/eosin (H&E) staining of a cross-section in an acellular graft (a) and a cellular (MSC-seeded) graft (b) 60 d after implantation. (Scale bar, 100 μm.) (c and d) CD31 staining of cross-sections for ECs in acellular (c) and cellular (d) vascular grafts. The samples were counterstained with H&E. CD31 staining is shown in brown. Arrows indicate EC monolayer on the lumen surfaces. (e and f) MHC staining of cross-sections for SMCs in acellular (e) and cellular (f) vascular grafts. MHC staining is shown in brown. Arrows indicate SMCs. (g and h) ECM remodeling in acellular (g) and cellular (h) vascular grafts. Verhoeff's elastic staining of cross-sections highlights collagen (pink) and elastin (black). Arrows indicate positive elastin staining. (Scale bar: c–h, 100 μm.) ∗, area with PLLA polymer.

