
Figure 1.
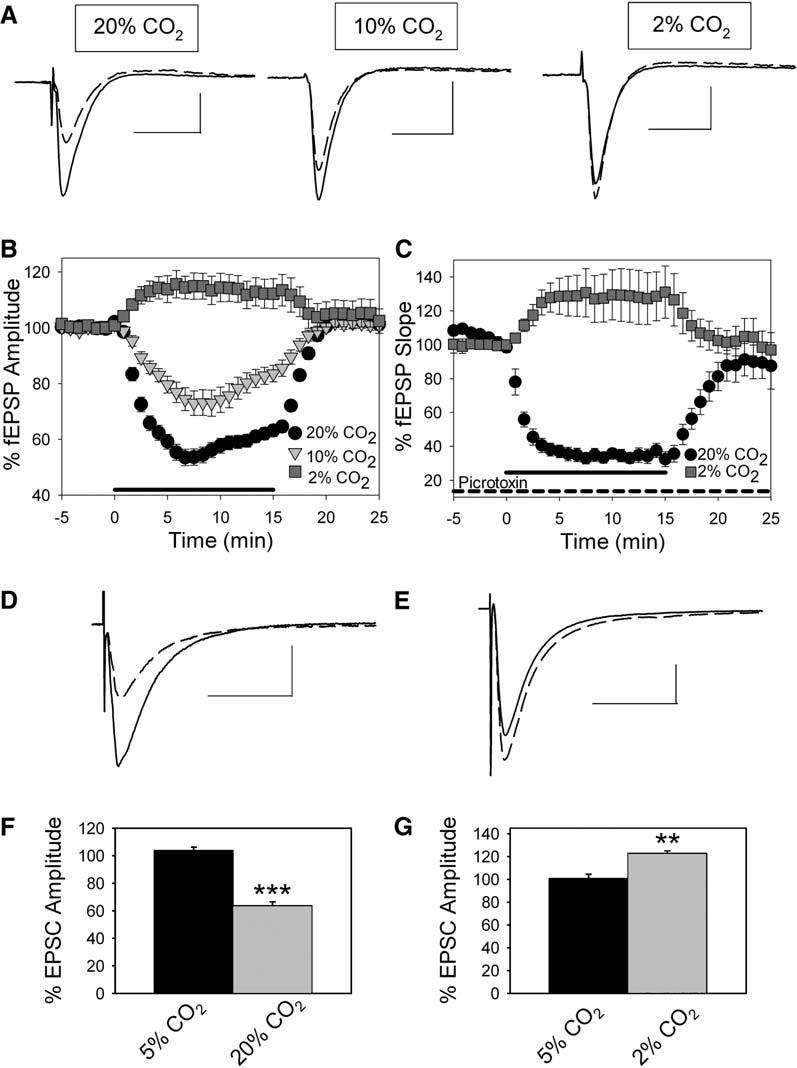
Changes in CO2 Levels Alter Synaptic Transmission and Adenosine Levels in Area CA1
(A) Field EPSPs averaged from a single experiment. Control (solid) and 20% CO2, 10% CO2, and 2% CO2 exposure (dashed). Scale bars, 25 ms, 0.5 mV. (B) Time course of fEPSP inhibition when aCSF CO2 level was changed from 5% (control) to hypercapnia (20% CO2, circles, n = 23; 10% CO2, triangles, n = 11) or hypocapnia (2% CO2, squares, n = 11) for 15 min (mean ± SEM). Thick line on x axis represents CO2 manipulation. (C) Time course of fEPSP inhibition during GABAA receptor blockade with 100 μM picrotoxin when aCSF CO2 level was changed from 5% (control) to hypercapnia (20% CO2, circles, n = 8) or hypocapnia (2% CO2, squares, n = 7) for 15 min (mean ± SEM). Thick line on x axis represents the timing of CO2 manipulation. (D) Excitatory postsynaptic current (EPSC) from a CA1 pyramidal cell under control conditions (5% CO2; solid line; average of five EPSCs) and during exposure to 20% CO2 (dashed line; average of five EPSCs). Scale bars, 25 ms, 200 pA. (E) Excitatory postsynaptic current (EPSC) from a CA1 pyramidal cell under control conditions (5% CO2; solid line; average of five EPSCs) and during exposure to 2% CO2 (dashed line; average of five EPSCs). Scale bars, 25 ms, 200 pA. (F) Average EPSC during 5% CO2 (black bar; n = 5) and during exposure to 20% CO2 (gray bar; n = 5; ***p < 0.001, Student's t test). (G) Average EPSC amplitude during 5% CO2 (black bar; n = 5) and during exposure to 2% CO2 (gray bar; n = 5; **p < 0.01, Student's t test). Error bars indicate standard error.