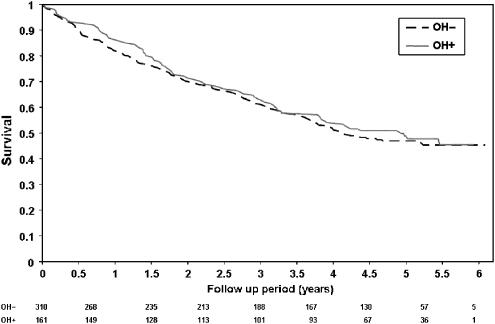
FIGURE 1.
Probability of mortality by orthostatic hypotension (OH) status. (OH−, without OH; OH+, with OH). Kaplan-Meier curves for 3.47 years total mortality rate in association with OH. (Wilcoxon test, P = .44, Log-rank test, P = .56). Rows indicate the number of persons under observation at each time period.

