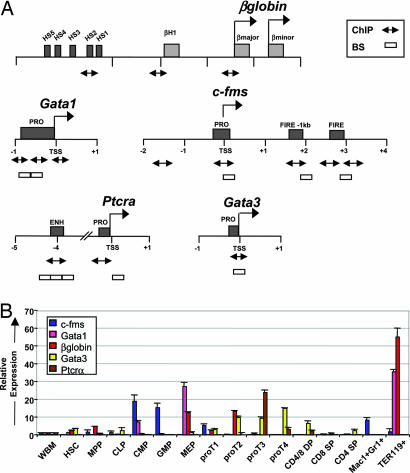
Fig. 1.
Expression analysis of lineage-affiliated genes in purified hematopoietic cell subsets. (A) Locus maps of the β-globin, Gata1, c-fms, Ptcrα, and Gata3 regulatory regions. Numbers indicate the nucleotide position in kilobases relative to the TSS indicated by right-facing arrows. Dark gray boxes represent the regulatory regions, designated names of the elements are shown, and light gray boxes indicate coding regions of the β-globin genes. qRT-PCR products for ChIP assays are indicated by double-ended arrows. Open boxes indicate the amplicons for the BS analysis. (B) Distribution of lineage-affiliated gene expression. Expression of c-fms, β-globin, GATA1, GATA3, and Ptcrα in hematopoiesis as measured by qRT-PCR. Relative expression to BM after β-actin normalization is shown on the y axis by using the comparative Ct (2−ΔΔCt) method. Error bars represent mean ± SD of three independent sort experiments.

