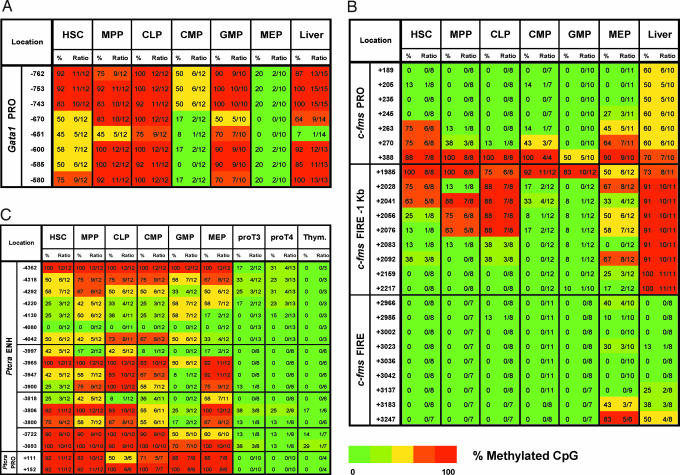
Fig. 4.
HSC and committed progenitors exhibit distinct DNA methylation patterns. BS analysis across the regulatory regions of Gata1 (A), c-fms (B), and Ptcrα (C) genes in HSC, MPP, CLP, CMP, GMP, MEP, proT3, proT4, and liver cells. Results obtained for the Ptcrα gene are also described in ref. 49. The percent methylation of each CpG dinucleotide was determined by the number of methylated clones in the total number of clones sequenced as indicated in the heat map ranging from 100% methylated (red) to 0% methylated (green).

