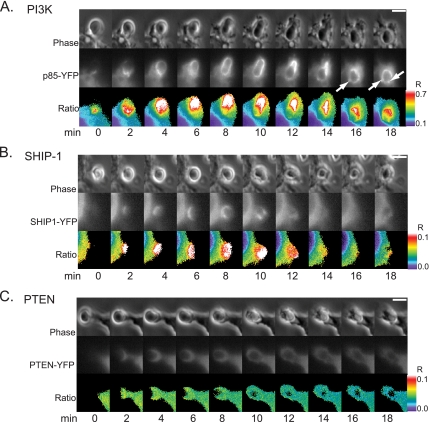
Figure 1.
Ratiometric imaging of p85-YFP, PTEN-YFP, and SHIP1-YFP relative to CFP during phagocytosis of IgG-opsonized erythrocytes. Phase-contrast (top), YFP (middle), and ratio (bottom) image time series of RAW macrophages during FcR-mediated phagocytosis. Color bars indicate the range of the calculated RM in the ratio time series (bar, 5 μm). (A) p85-YFP was present on the phagosome during phagocytosis. Arrows indicate the punctate structures that formed after closure. (B) SHIP1-YFP was present on the phagosomal membrane during phagocytosis. (C) PTEN-YFP remained distributed throughout the cytosol during phagocytosis.

