Figure 8.
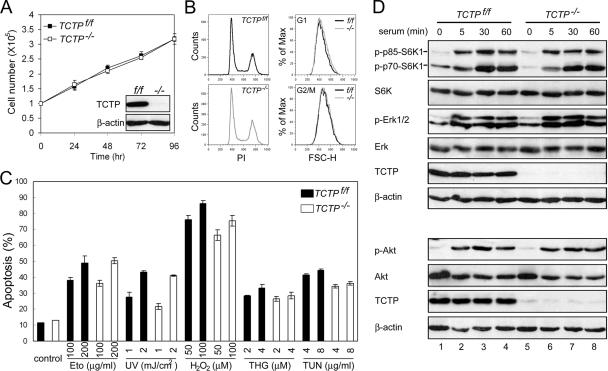
Control and TCTP−/− MEFs manifest similar proliferation and survival activities. (A) TCTPf/f and TCTP−/− MEFs grow similarly in culture. Control or TCTP−/− MEFs were seeded in complete growth medium, and at various time points after seeding cells were counted by trypan blue exclusion assays. Inset in A shows the TCTP protein levels in cells used in this study. (B) Control and TCTP−/− MEFs display similar cell size. Exponentially growing control or TCTP−/− MEFs were stained by propidium iodide and analyzed by flow cytometry. The DNA content (PI) and the forward scatter height (FSC-H) distributions of cells at the G1 or G2/M phase of the cell cycle are as indicated. (C) Control and TCTP−/− MEFs manifest similar apoptotic sensitivities to death inducers. Control or TCTP−/− cells were treated with two different doses of various apoptotic stimuli as indicated. One day after treatment, cells that had undergone apoptosis were quantified by annexin V staining assay. Data shown here are mean ± SD of triplicates from experiments that were repeated three times with very similar results. Eto, etoposide; THG, thapsigargin; TUN, tunicamycin. (D) Similar activation of S6K1, Akt, and ERK after serum stimulation of control or TCTP−/− MEFs. Cells to be analyzed were starved and restimulated with serum for various times as indicated. The same cell lysates were analyzed by two immunoblots (top and bottom) using antibodies specific to TCTP, β-actin, total, or active form of S6K1 (P-T389), Akt (P-S473), and ERK as indicated.

