
Figure 1.
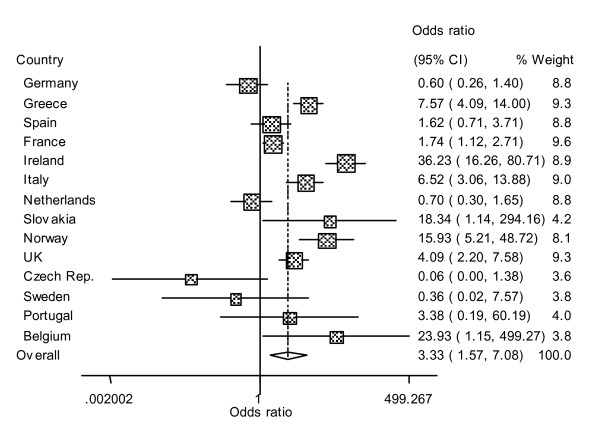
Forest plot. Forest plot of the odds ratios (FS/AS) assuming random effects. Only 14 countries after removal of those with zero counts in both surveys. The solid vertical line is showing an odds-ratio of 1 (no effect). The contribution of each country (weights) to the meta-analysis is represented by the area of the box in the plot. The diamond at the bottom shows the overall treatment effect. Weights are derived from the Mantel-Haenszel method.