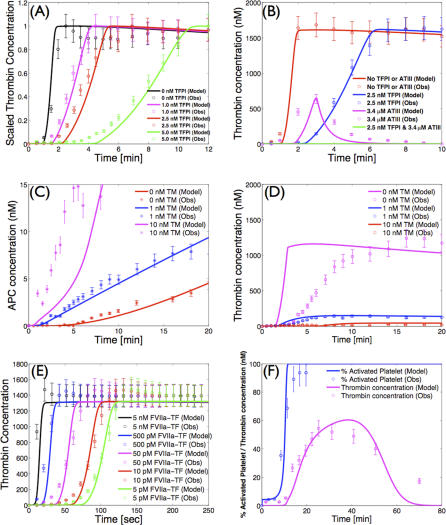
Figure 2. Model Validation Using Published In Vitro Datasets.
(A) Thrombin concentration versus time as a function of TFPI concentration following the addition of 1.25pMTF–FVIIa to synthetic plasma.
(B) Thrombin concentration versus time for different combinations of TFPI and ATIII following the addition of 1.25pM TF–FVIIa to synthetic plasma.
(C) APC concentration versus time as a function of TM concentration following the addition of 1.25pM TF–FVIIa to synthetic plasma.
(D) Thrombin concentration as a function of time as a function of TM concentration following the addition of 1.25pM TF–FVIIa to synthetic plasma.
(E) Thrombin concentration versus time as a function of TF–FVIIa initiation strength in synthetic plasma.
(F) Fraction of activated platelets and thrombin concentration as a function of time in the cell-based assay.
The synthetic plasma assay cases were reproduced from Mann and coworkers [31,41], while the platelet activation data in (F) were reproduced from Roberts et al. [40]. The GraphClick software (Arizona Software, http://www.arizona-software.ch) was used for data extraction where a coefficient of variation (CV) of ±10% was added to the data to account for extraction and experimental error. Initial conditions for all simulations are given in Protocol S1.

