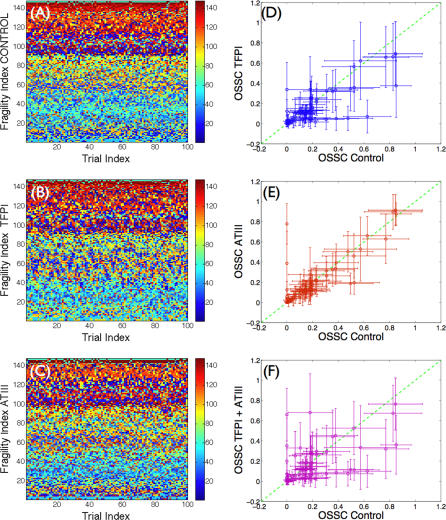
Figure 3. Sensitivity Analysis of the Coagulation Cascade.
OSSC values were calculated using randomly generated parameter sets constructed by perturbing the nominal parameter set by up to ±50% for each parameter (N = 100).
(A–C) The x-axis denotes the trial index (index of the random parameter set), while the y-axis denotes the fragility index. The fragility index is calculated by determining the parameter index of the rank-ordered the OSSC values (the parameter index corresponding to the most fragile parameter has fragility index of 1; the next fragile is 2, while the most robust parameter has a fragility index of 148). The fragility index shows the robustness of a parameter; the smaller the fragility index, the more fragile the parameter. The parameter types are color-coded (shown in the color bar) and organized by biological function: 1–16, subendothelium interactions; 17–40, plasma interactions; 41–62, platelet surface binding; 63–77, platelet activation; 78–107, reactions on platelet surface; and 108–148, inhibitory reactions.
(D–F) The OSSC values from the TFPI, ATIII, and TFPI + ATIII cases versus the control.

