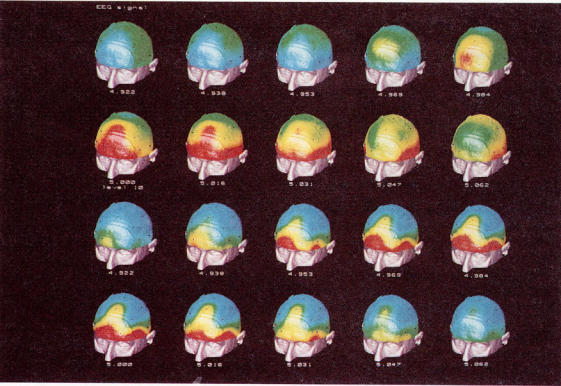
Figure 6.

Temporal sequence of:
(1) the original EEG signal (on the first two rows);
(2) the module of the 10th level resulting from the wavelet decomposition (k = 2, fo = 0,01, a = 1/3) at the same instants (two last rows).

Temporal sequence of:
(1) the original EEG signal (on the first two rows);
(2) the module of the 10th level resulting from the wavelet decomposition (k = 2, fo = 0,01, a = 1/3) at the same instants (two last rows).